Elliott Wave Cheat Sheets
Other Sources
This is a list of other helpful sources on Elliott Wave Theory
Determining Wave Degree
Reviewing numerous sources on the internet it is obvious that the labelling degrees is not an exact process. One person's Intermediate degree can be another person's Minor degree and another's Primary degree. It really is of little consequence, however. Wave theory depends on scale and fibbonaci percentages, both of which will be the same regardless of what degree you are labeling.
Regardless of which degree you start the labeling process with, it is very important that you label comparative moves as the same degree. Waves are supposed to have the "right look" in both price movement and, much more loosely, time to completion. It is not realistic for a wave 4 which maps out 122 bars to completion to be the same degree as a wave 2 that finished in 4 bars.
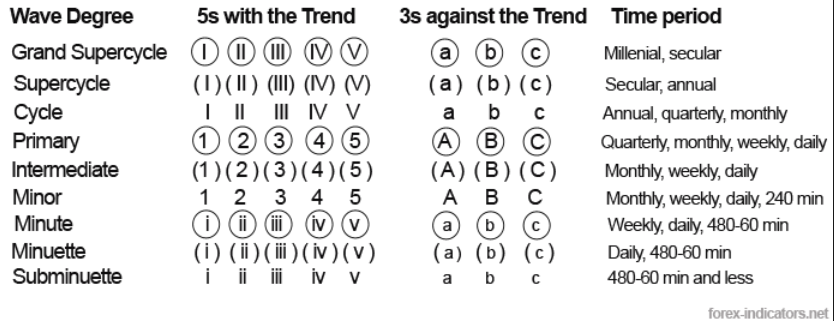
We found this handy chart which explains how these folks determine degree which may be helpful.
In our practice, when we look at a daily chart and see the smallest impulsive waves in which the swings (you can count waves 1,2,3,4,and 5 but not necessarily the internal structure of those waves) can be recognized, we start with a Minutte (Pink, Parenthesis, italic) degree label. So, the smallest clearly identifiable swings (but not necessarily the internal structure) are Minutte degree and graduate up and down from there with the time frame being viewed.
Correction Times
Use the appropriate time frame to analyze the correction. If you are trying to track an ongoing Intermediate degree correction on a 15 minute time frame you will be confused, exhausted, and sadly disappointed. The difficulty is that on smaller time frames you will be tempted to label the internals of the correction in the incorrect degree. Use the proper time frames to note the swings, then look to the smaller time frames to establish the internals.
Do not rush the count. You must make sure the entire correction exhibits the "look and feel" that is expected on the proper time frame for the degree you are working with.
Did it retrace far enough? Did it take an appropriate amount of time to retrace? A W4 Flat should take at least twice as long as W2 zigzag, and perhaps up to 3-4 times as long. Beyond that, your wave count is suspect or you should look to a complex correction analysis. Was the prior impulse wave particularly long or a 5 of 5? If so, a complex correction is more likely.
Note that the charts below are for the wave 2 and wave 4 corrections for the given degree and not the ABC corrections following wave 5 of that degree. For the wave 5 ABC corrections, you should look to the analysis of W2 and W4 at one higher degree.
Subminuette (Blue small case italic waves ii and iv)
Micro circle red a, b, c
| Chart View Time | View Indicators on 5 minute chart |
| Generally visible on: | 3 general swings visible on 15 min chart |
| Clearly visible on: | 5 minute shows distinct waves |
| Zigzag time to complete: | ~1 hour (Can be 2 to 3 times longer in indecisive areas - such as ending diagonals and tops.) |
| Flat time to complete: | ~ 3-4 hours (Can be 2 to 3 times longer in indecisive areas - such as ending diagonals and tops.) |
| Are they tradable: | Hold the position and do not trade the correction. Ride it out. As a whole correction it may be tradable on short term charts, but it is hard to catch the swings and can’t get any predictable meaningful profit from them. Better to just wait for the trend to resume |
Minuette (Pink, parentheses small case Italic waves II and Iv)
| Chart View Time | 15 or 30 minute chart |
| Generally visible on: | 3 general swings visible on hourly chart |
| Clearly visible on: | 15 to 30 minute charts shows distinct waves |
| Zigzag time to complete: | ~ 13 hours - about 2 days |
| Flat time to complete: | ~ 20 hours - about 3-4 days |
| Are they tradable: | Yes. |
Minute (Green, circle small case italic waves ii and iv )
| Chart View Time | Hourly Chart |
| Generally visible on: | 3 general swings visible on 2 hour chart |
| Clearly visible on: | 1 hour chart |
| Zigzag time to complete: | ~ 12 to 24 hours (2-5 days) |
| Flat time to complete: | ~ 24 to 48 hours (4 to 8 days) |
| Are they tradable: | Clearly tradable |
Minor (Red, waves 2 and 4)
| Chart View Time | 3-4 Hour Chart |
| Generally visible on: | 3 swings on the daily chart |
| Clearly visible on: | 3 hour chart shows distinct waves |
| Zigzag time to complete: | Normally 7-12 days (1-2 weeks) Longest we've seen is 43 days |
| Flat time to complete: | Normally 14 -24 days (2-4 weeks) |
| Trading: | Absolutely.
These can be
large corrections
(DJ 500 pts,
SP100 to
200). ZIGZAGS are pretty clear and can be very profitable to trade. FLATS: (Wave 4) can be strong in the countertrend to the point you may question whether you missed wave 5 and are really in a larger ABC correction. Frequently a visible head and shoulders formation will form to signal the return to the larger trend and the beginning of (Wave 5). **** Complex waves and ending fifth wave diagonals are often seen as the final culminating wave pattern (Wave C) in this kind of larger degree corrective action.
DO NOT try to analyze a minor degree Flat on the 15 minute or even 30 minute time frame. You WILL make mistakes in the count and set yourself up for a loss. The 3 hour charts, while not showing the messy internal structure, will show you all you need to know to make the wave count and profit from the trade. Don’t Jump the gun on declaring C to be over on the 1st pivot beyond A, as it frequently will move to one more extreme. Borrowing from other TA, look for Wave 4 corrections to blow through the 20 and 50 SMA and test the 100 or 200 SMA despite what the wave theory may tell you about where they should end. The important thing to remember on a W4 correction is to be patient and wait for confirmation that it is over. |
Intermediate (Blue, parentheses wave 2 and 4)
| Chart View Time | Daily Charts | |
| Generally visible on: | Monthly Charts | |
| Clearly visible on: | Weekly Charts | |
| Zigzag time to complete: | ~4~15 - 20 weeks (4 - 5 months) | |
| Flat time to complete: | ~7~25 - 45 weeks (5 - 12 months | |
| Are they tradable: | Clearly |